Subsampling
Subsampling of Audio Files
This subsection demonstrates the subsampling of an audio file, in particular the effects of different subsampling rates on the
- time-domain signal
- frequency-domain signal (spectrum)
- subjective audio quality.
For the import of audio files and simple audio processing routines the python scikits-audiolab package is applied.:
from scikits.audiolab import wavread, Format, Sndfile
import numpy as np
from matplotlib import pyplot as plt
The test audio probe is 12-35.wav.:: It contains a speech probe of about 4 seconds length, coded in PCM (Pulse Code Modulation) with 16 bit per sample and a sampling rate of 16 kHz. These parameters can be accessed after the import of the audio file as follows.:
data, fs, enc = wavread('12-35.wav')
print type(data)
L=len(data)
dur=L*1.0/fs
print "Number of samples: ",L
print "Duration of audio probe in seconds: ",dur
print "Sampling rate: ",fs
print "Encoding: ",enc
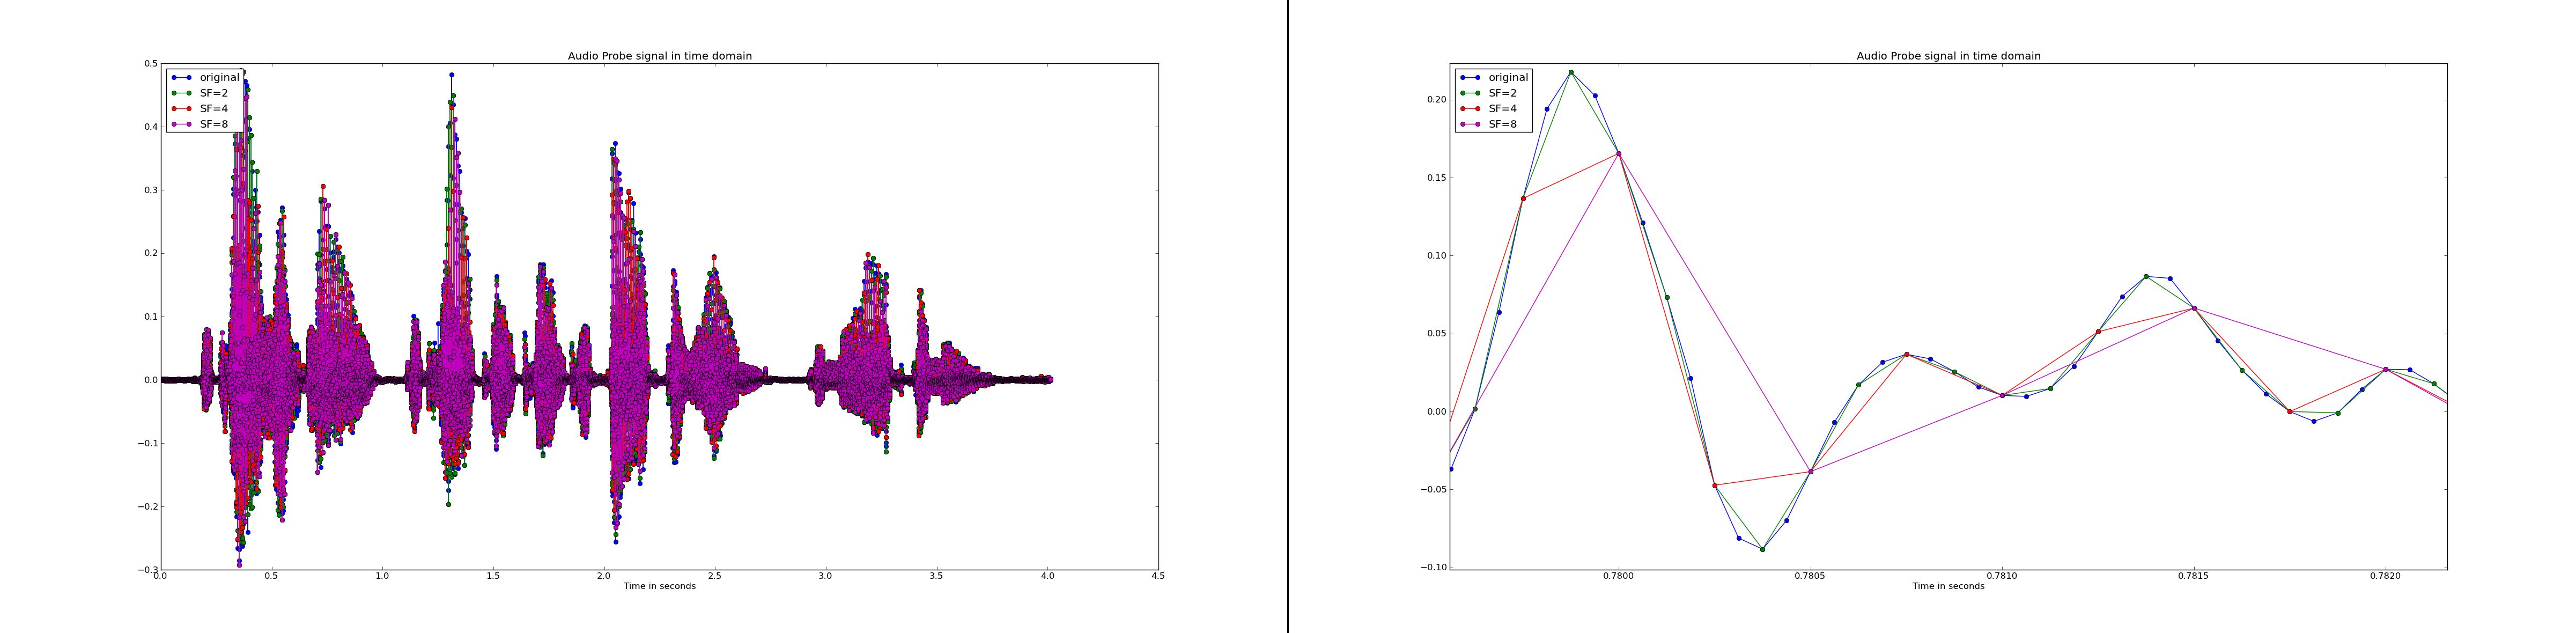
The time-domain representation of the original audio file is displayed in a matplotlib figure.:
time=np.array(range(L))/float(fs)
plt.plot(time,data,'-o',label="original")
plt.hold(True)
plt.title("Audio Probe signal in time domain")
plt.xlabel("Time in seconds")
Then three subsampled versions of the input signal are generated. The subsampling factors are 2,4 and 8. The subsampled audio files are saved as .wav files and plotted in the same figure as the original signal.:
format = Format('wav')
SubSampling=[2,4,8]
for F in SubSampling:
        outfilename="probe12-35ss%d.wav"%(F)
        dataSS=data[::F]
        timeSS=np.array(range(L))/float(fs)
        timeSS=timeSS[::F]
        plt.plot(timeSS,dataSS,'-o',label="SF=%d"%(F))
        f = Sndfile(outfilename, 'w', format, 1, float(fs)/F)
        f.write_frames(dataSS)
        f.close()
plt.legend(loc=2)
The left hand side of the figure below displays the entire time-domain representation of all 4 signal versions, the right hand side shows only a small region of the 4 files. Note the smoothing effect of subsampling.
The spectral power density function displays the distribution of the signal power over the frequency range. Here it is computed using the Fast Fourier Transform (FFT) provided by numpy. The result of the FFT is complex valued. The corresponding power density distribution is obtained by taking the square of the absolute value of the FFT result. The code snippet below calculates the spectral power density function for all 4 signal versions. The spectras are plotted in a matplotlib figure, which is shown below.:
plt.figure()
plt.subplot(2,2,1)
D=np.fft.fft(data)
pD=np.abs(D)**2
L=len(pD)
freq=np.array(range(L))*float(fs)/L
plt.plot(freq,pD)
plt.title("Spectrum of original signal")

i=2
SubSampling=[2,4,8]
for F in SubSampling:
        dataSS=data[::F]
        plt.subplot(2,2,i)
        D=np.fft.fft(dataSS)
        pD=np.abs(D)**2
        L=len(pD)
        freq=np.array(range(L))*float(fs/F)/L
        plt.plot(freq,pD)
        plt.title("Subsampling Factor %d"%(F))
        i+=1
plt.show()
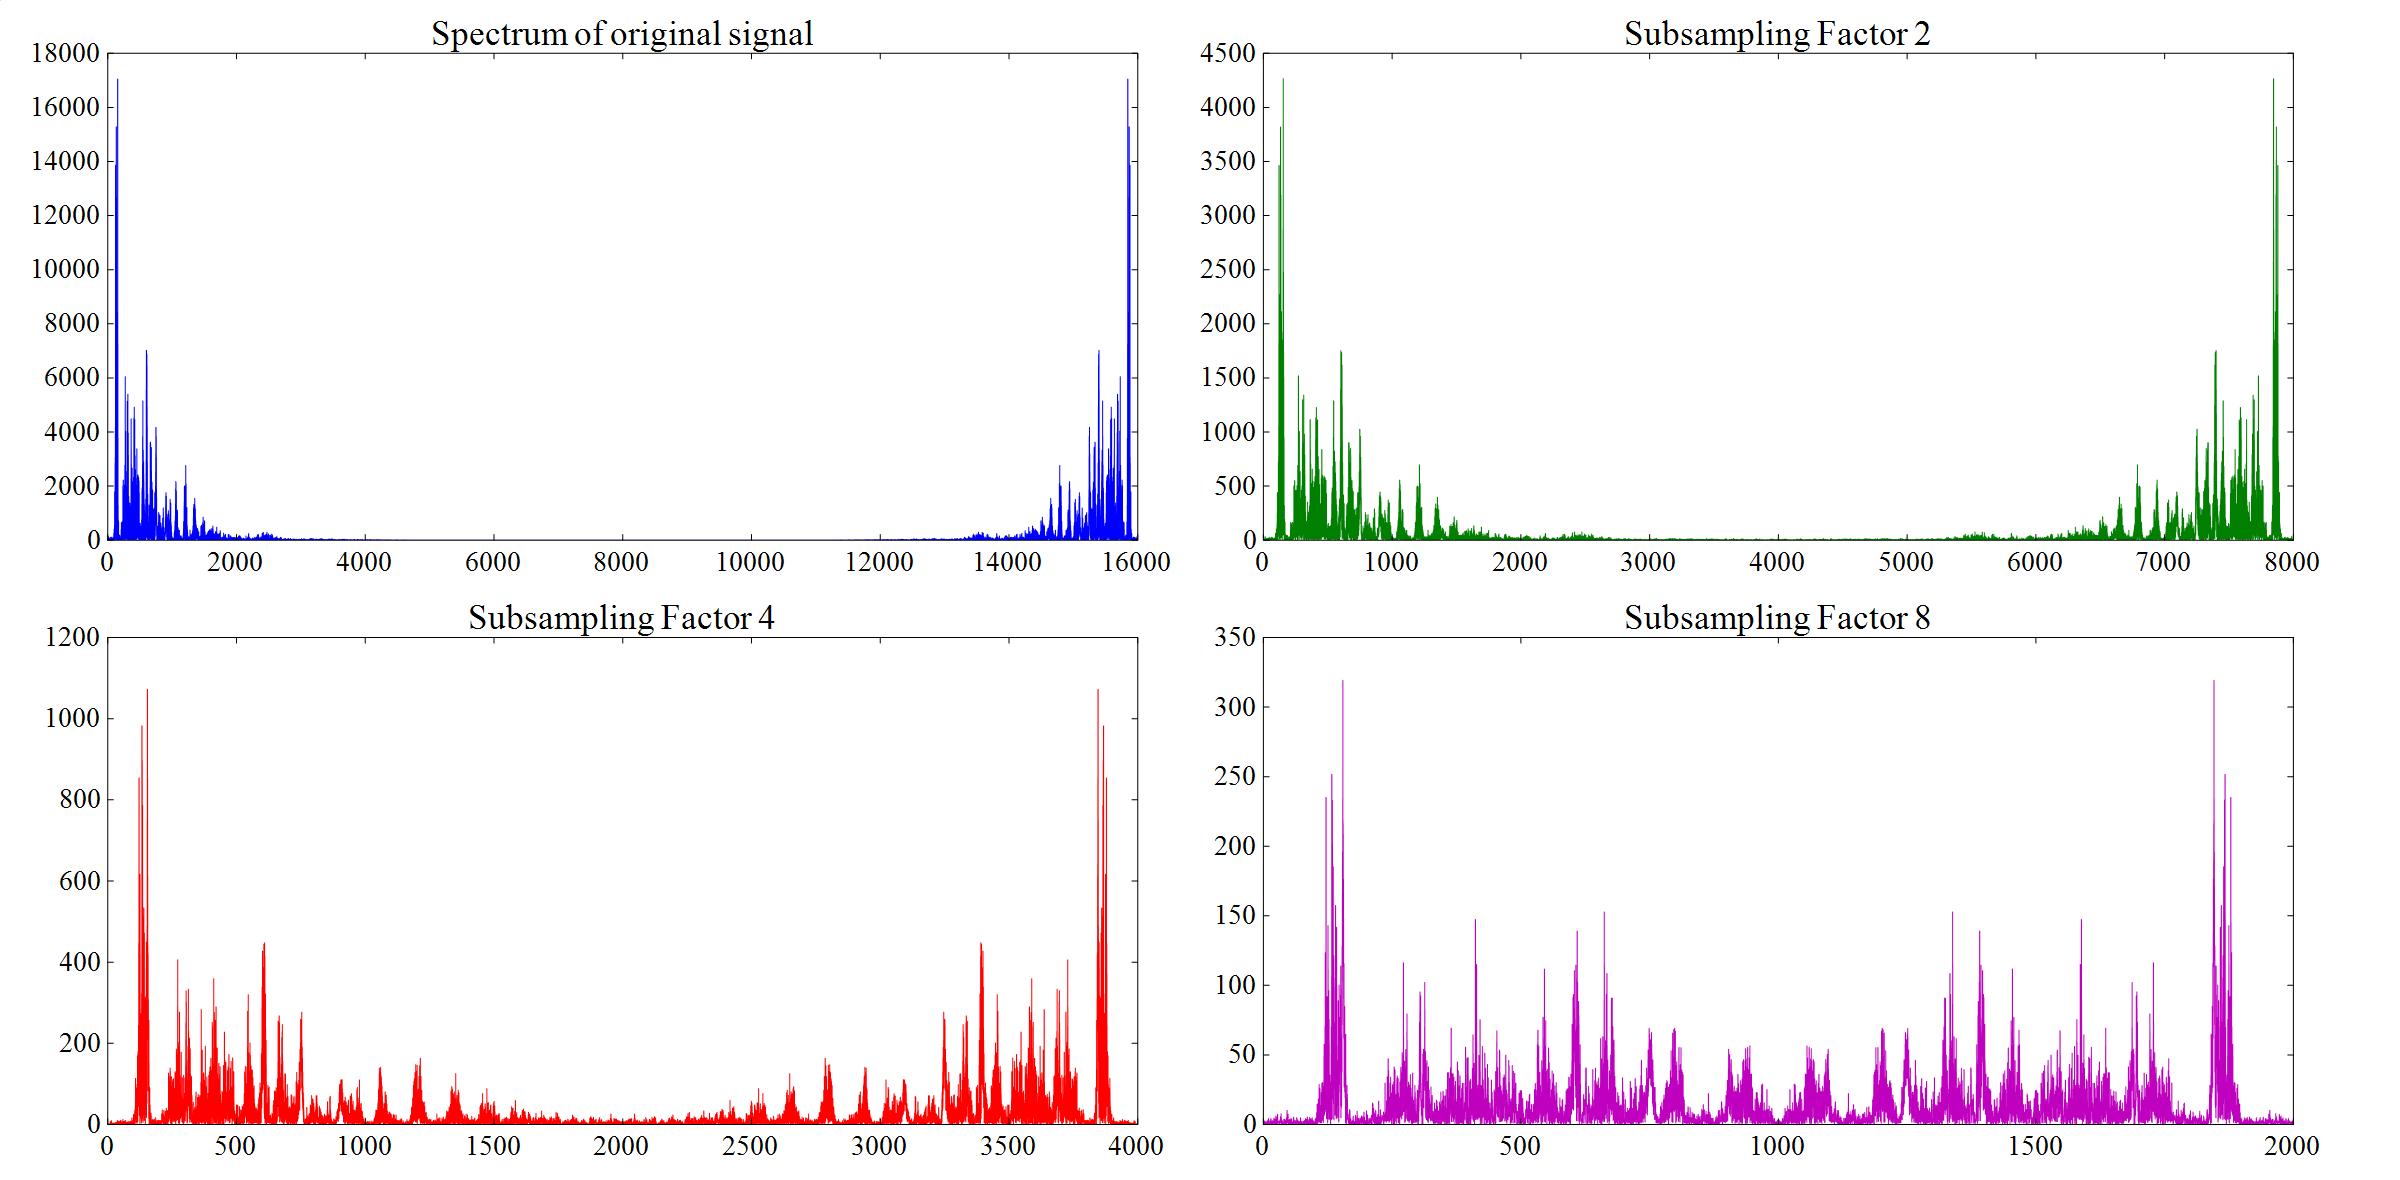
Compare the original audio probe with the 3 subsampled versions.
These probes show, that the audio quality is severly impaired for subsampling facotrs of 4 (4kHz sampling rate) and 8 (2kHz) sampling rate. The quality decrease is caused by aliasing: Since the sampling frequency is less than 2 times the maximal frequency in the audio probe successive replicas in the periodic spectra merge, higher freuencies are disturbed.
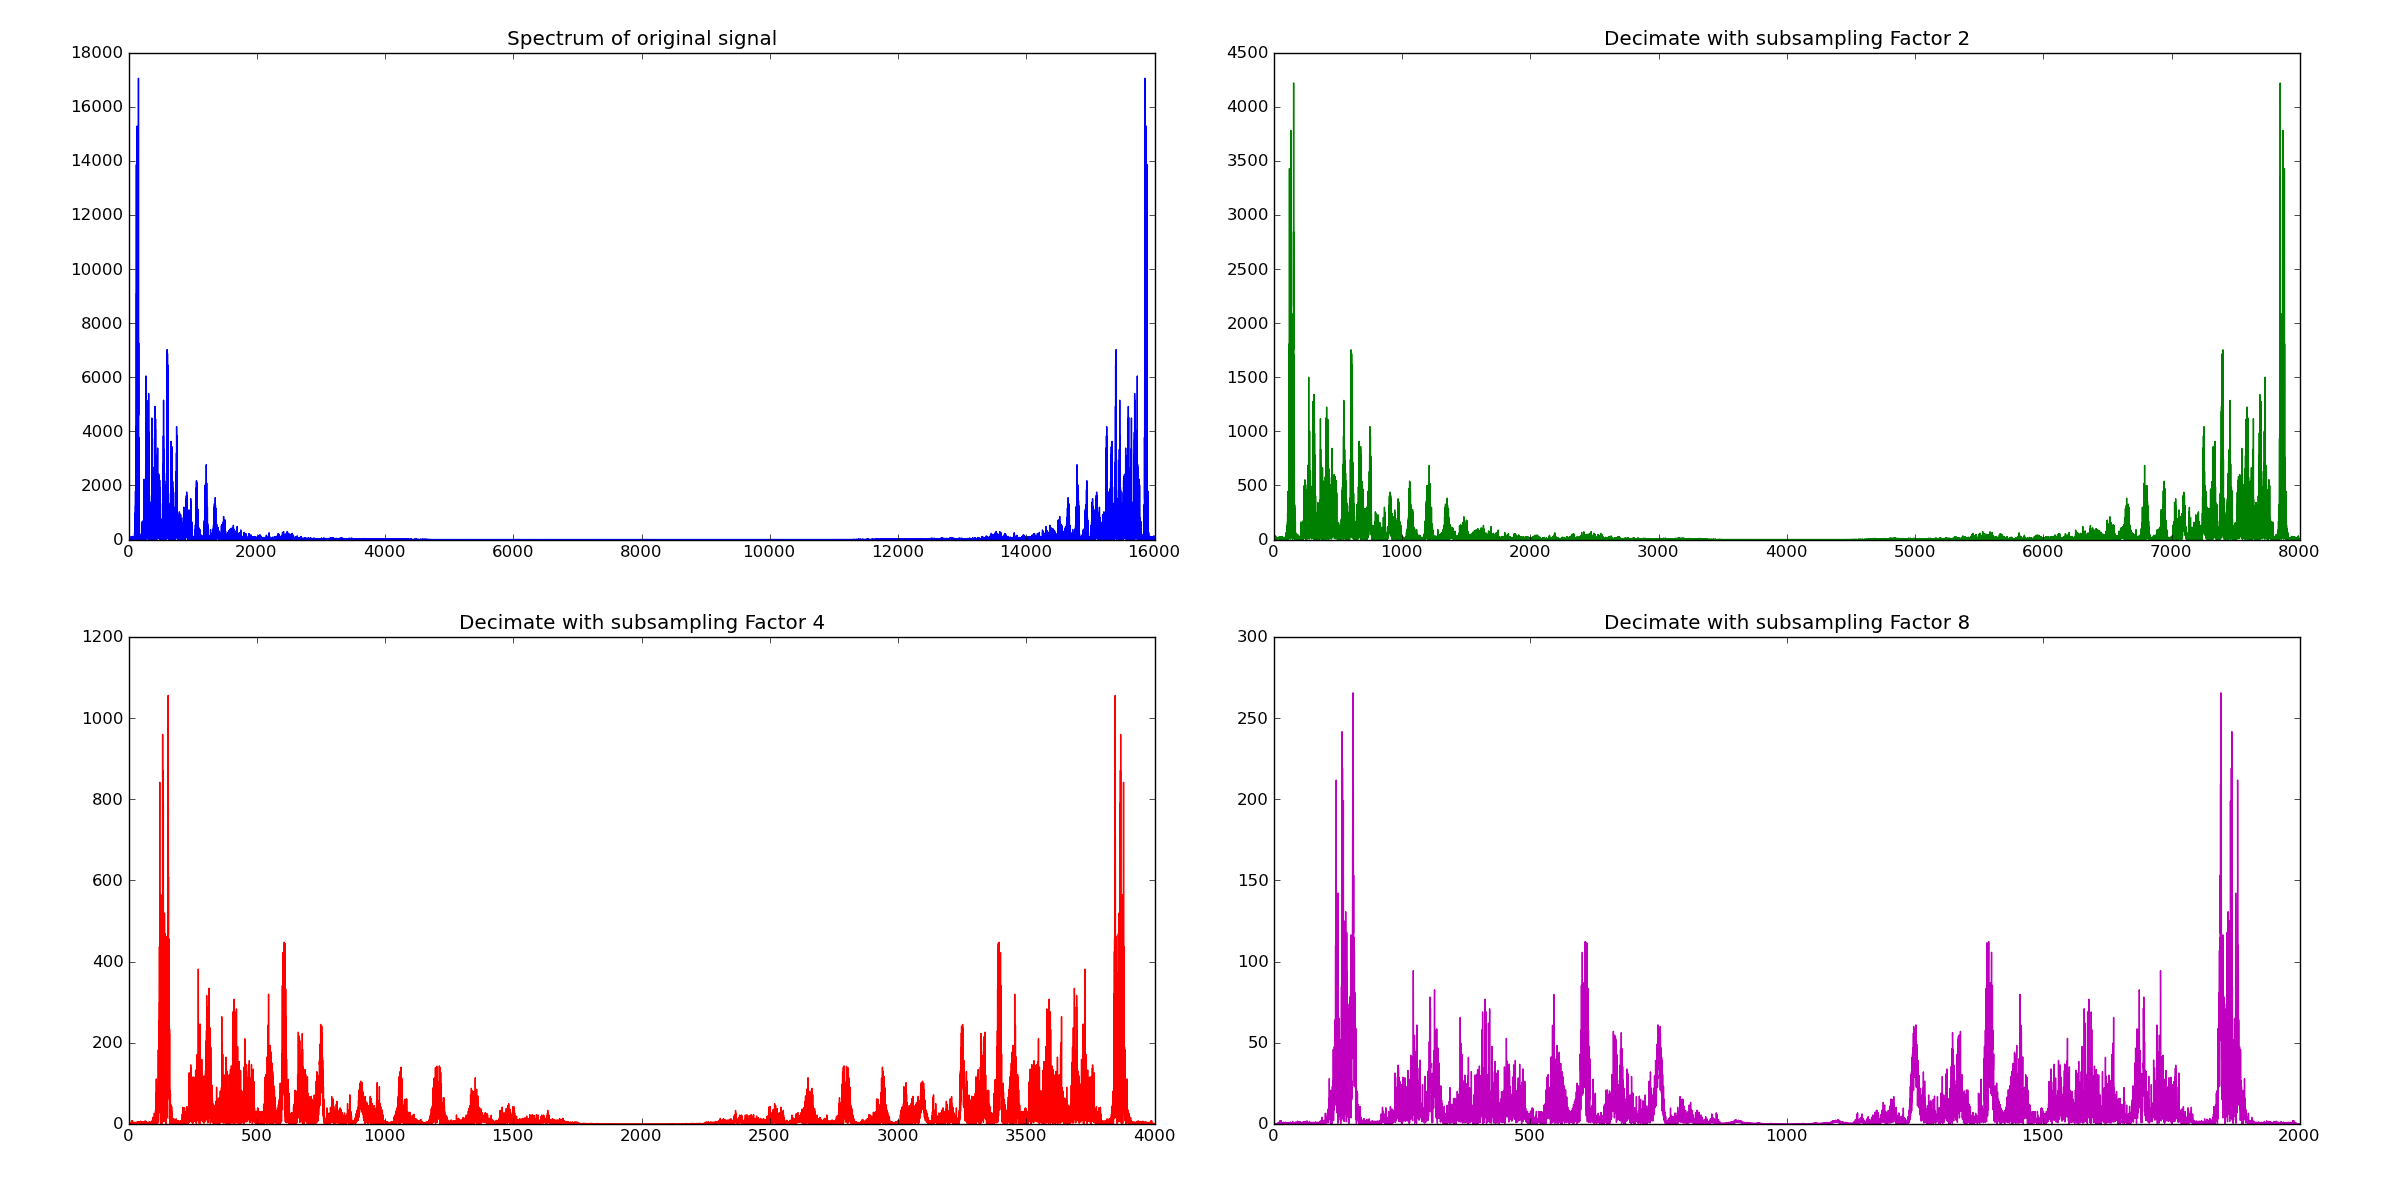
Subsampling with Antialiasing Filter
Aliasing, i.e. the merge of successive replicas of the spectra can be avoided, if the input signal is filtered such that its maximum frequency is less than half of the sampling frequency. E.g. for a fixed sampling frequency of 4khz the signal must be filtered into a spectral range between 0 and 2 kHz. This antialising filtering surpresses the noise, caused by aliasing, however it surpresses higher frequencies at all. The combination of antialising filtering and subsampling is called decimation. The Scipy signal package provides the method decimate(). In the previous subsection subsampling was realized by:
dataSS=data[::F]
This subsampling procedure is replaced by:
datadecimate=decimate(data,F)
in order to obtain decimation. The resulting spectras of the subsampled audio probes are shown below. As can be seen for each subsampling rate the audio probes spectrum is limited such the maximum signal frequency is less than half of the sampling frequency.
The corresponding audio files are:
Music File: Comparison with and without Antialising
In the previous subsection simple subsampling and antialising plus subsampling (=decimation) has been compared for an audio speech probe. The difference in quality is even more evident as the following samples show. These samples have been generated in the same way as in case of the speech probe above.